The Power of High Intent Advertising
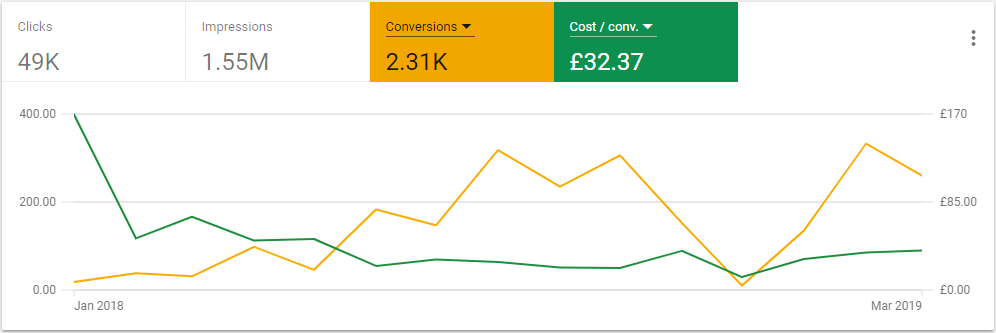
Scaling a marketplace platform to thousands of targeted ads and driving conversion volume by 10x while reducing Cost per Acquisition by 70%
Understanding your data is key to making better strategic decisions and tracking your business goals. At DataKove, we want to help you discover actionable insights that can help grow your business and drive forward your sales, marketing, operations and commercial strategies.
How do I build a website? How are people using my site? How can I increase sales and generate leads? We can help develop your website and digital marketing capability from start to finish
Whether you have massive amounts of unstructured data or want to start collecting it, we can help set up your automated data gathering processes and generate insights to drive your revenue growth
From integrating multiple data sources and forming robust data pipelines, through to creating machine learning models, we can help drive your future business decisions with the power of AI and predictive analytics
Scaling a marketplace platform to thousands of targeted ads and driving conversion volume by 10x while reducing Cost per Acquisition by 70%
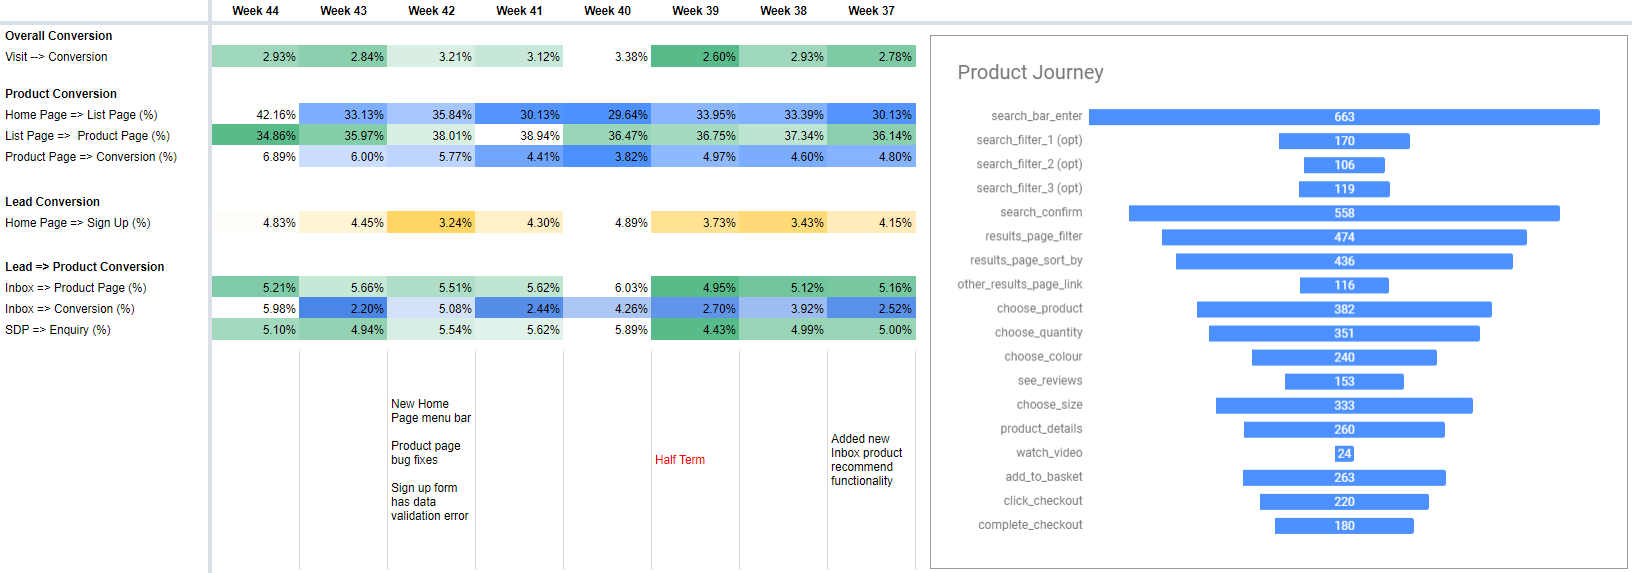
Understanding your customer journey from start to finish to drive customer interaction and increase conversion on your website
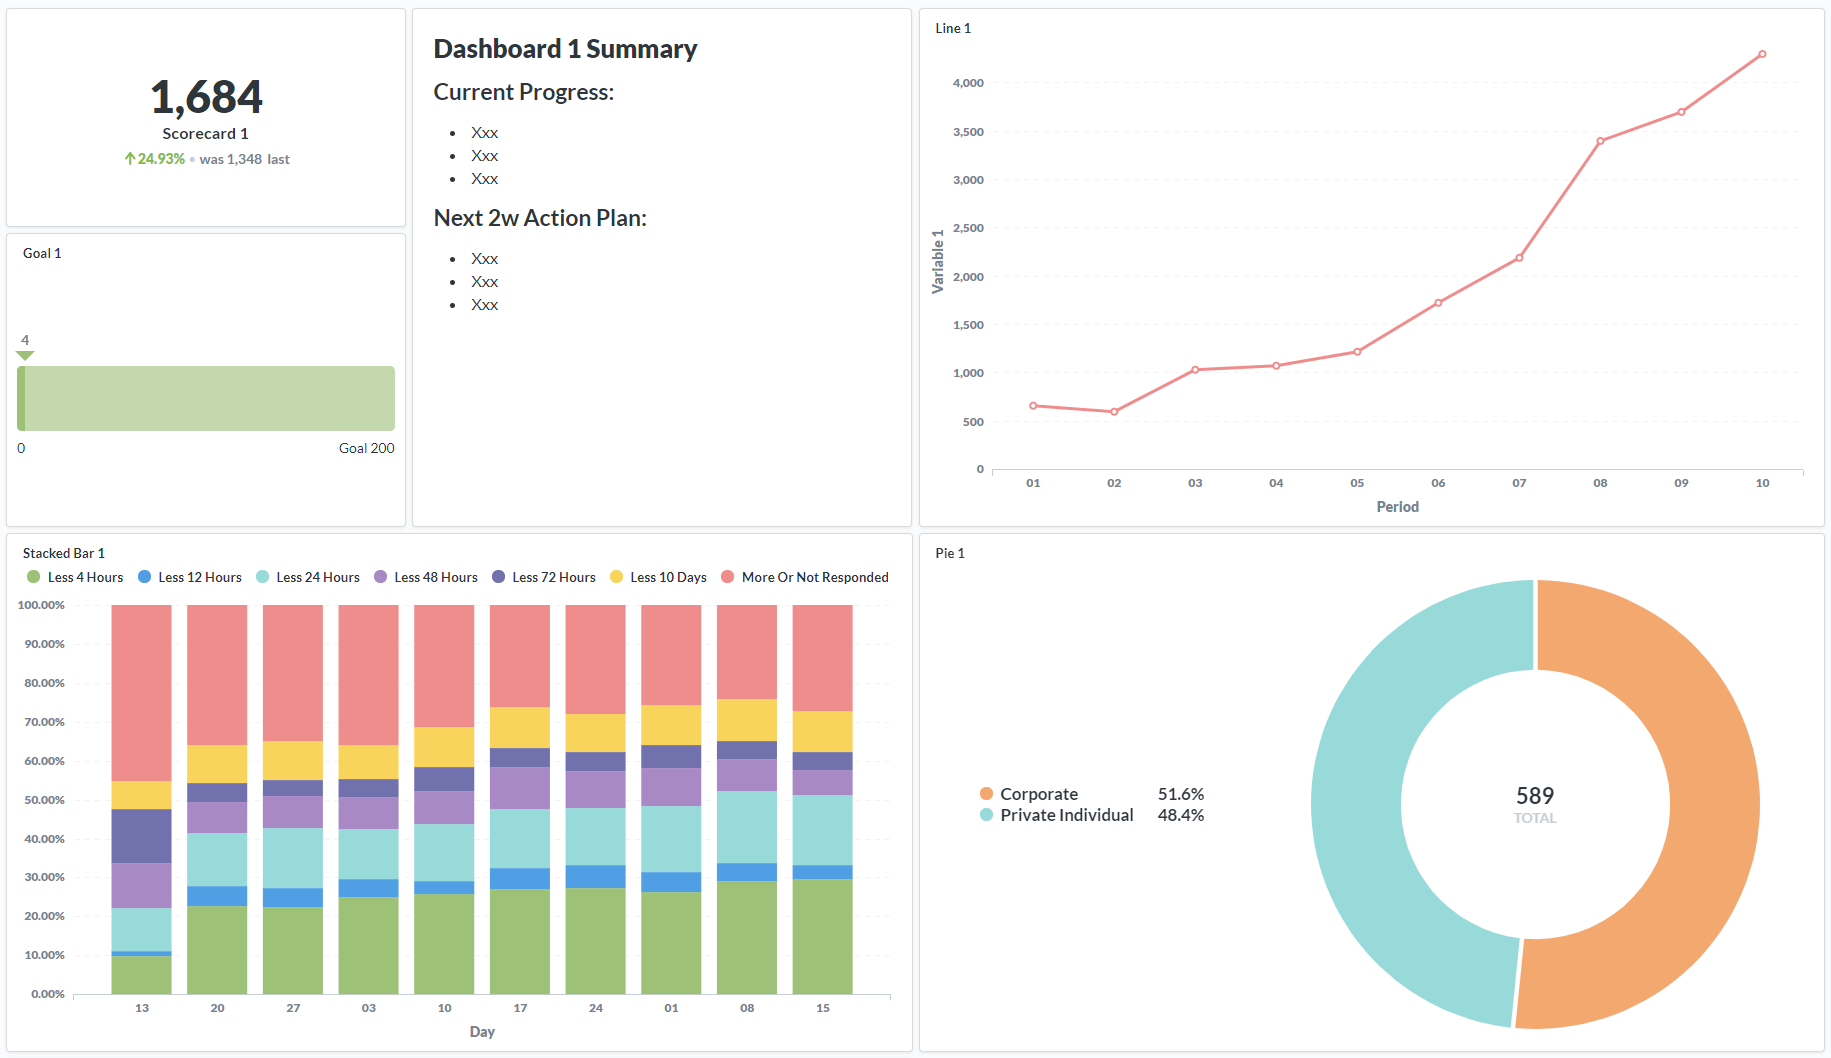
Develop and integrating data from Google Ads, Google Analytics, Facebook Ads and internal data into a reporting database linked to Business Intelligence software
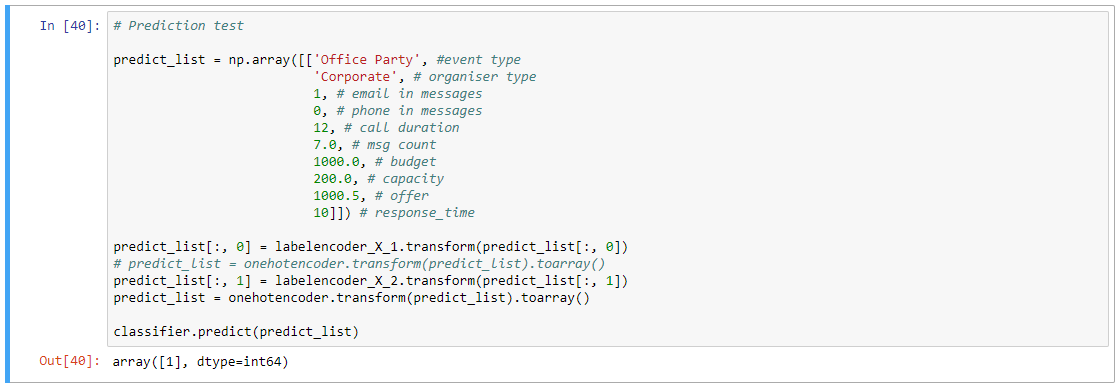
Driving increased conversions and sales team efficiency through developing predictive algorithms built on historic data
Hi, my name is Kurt and I’m the Founder and Director of DataKove, a data analytics and digital strategy consultancy.
Data gathering, analysis and collaboration does not have to be a dark art that only technical data scientists and analysts understand. We want to democratise data for businesses so that it can be useful for everyone across all areas, from marketing and sales through to operations and finance.
Whether you have a mature database setup with terabytes of data that you’re unsure what to do with, currently tracking sales and financials in multiple spreadsheets, or have yet to build your own website and digital presence, we want to help lead you through your data development journey.
Having consulted for FTSE100 companies and rapid growing tech startups across all phases of the data life cycle, we bring a wealth of diverse knowledge to help find a solution to your business needs.
A marketplace platform is unique in it’s digital advertising strategy due to the complexity of having a larger number of products compared to the average online retail store. For example, across my client’s marketplace, they have over 20,000 venues across hundreds of locations in the UK. Because of this, targeting all relevant keywords for all products on a marketplace becomes a scalable nightmare. However, given the right strategy, the company can leverage these large number of products to it’s advantage.

We developed a unique and scaleable Single Keyword Ad Group (SKAG) strategy that enabled the client to target all possible variations of keywords linked to their products. For example, keyword variations such as ‘London meeting room hire’ or ‘Cardiff corporate event space venue hire’. The automated scripts we created enabled generation of all locations, event types and keyword modifier combinations where the client had venues available. This resulted in more than 1 million keywords being produced to cover all potential combinations. Within this extremely wide net, around 1,500 keywords generated search impressions. Once these were discovered, they were scaled and grown with an automated ad bidding model that increased the volume of conversions by 10x while reducing cost per conversion by 70%.
Having data spread across multiple platforms and formats can be a nightmare to analyse, especially when you want to see your data and business performance on a regular basis. My client had data across multiple spreadsheets, two internal databases, Google Analytics, Google Ads, Facebook Ads and Salesforce that they wanted to report on weekly. Bringing all of this data together in one place was key for them to be able to run their business efficiently and constantly monitor their performance.

We developed multiple scripts that accessed these platform APIs on our web server to regularly pull in data from these sources into a centralised PostgreSQL database. We then setup a Business Intelligence tool for the client to access all of their data, create dashboards and perform any required analysis. The tool shown above is called Metabase – a free and open source Business Intelligence tool that is fantastic for quickly setting up and creating visualisations with your data.
There are many words thrown around these days to describe new trends in data: AI, machine learning, deep learning, big data, data lakes, neural networks etc. What’s important to draw out of all of this terminology is that data today can be analysed more efficiently and used to make better accurate predictions than ever before. Furthermore, this type of analysis is not just reserved for multinational corporations with terabytes worth of data. Insights can be driven from data for any business size, which is why we can’t emphasise enough the importance of gathering data for a business to help drive quicker and better decision making.

We developed a supervised machine learning model that could predict whether a customer would convert based on a number of variables. This model was built on a historic sub-sample of around 8000 customers. By inputting this historical data into a predictive classification model, the model trained itself to predict what features are significant in leading to a conversion e.g. number of messages exchanged, the type of organiser, response time etc. The image above demonstrates use of the final model to predict whether a new customer would convert – in this case, the ‘[1]’ means yes!
It is always frustrating seeing in Google Analytics that the number of users visiting your site daily is increasing, but the number of sales are unchanged. Google Analytics provides some excellent off the shelf dashboards that cover overall site performance, but often more granular detail is required by the user to truly understand what user journeys work on their site. Understanding how users behave on your website or application is key to improving your customer experience. From analysing and generating insights from the data, you can create actionable and informed changes to your platform journey and create a more meaningful and relevant experience to your users.
Note: Image is using real client analysis with dummy data – for illustration purposes

By implementing Google Analytics and Google Tag Manager (GTM) into a website’s analytics stack, the website owner can start to discover pain points in their various user journeys where drop off occurs. Common metrics that are looked at are ‘page bounce’ & ‘page exit’ rates across individual pages, but advanced segmentation and funnels can be used to drill down to what combination of pages most often lead to a conversion. Furthermore, by tagging events on your site with GTM, you can then see how a user interacts with your pages, from clicking buttons and checkboxes, through to watching a video or choosing an item from a list.